Grade 11 - Claim 1 - Target P

 Back to Results
Mathematics
Target P
Summarize, represent, and interpret data on a single count or measurement variable
Sample Item
Grade 11Test

Claim 1
Concepts and Procedures
Standards
ID-1
Represent data with plots on the real number line (dot plots, histograms, and box plots).
ID-2
Use statistics appropriate to the shape of the data distribution to compare center (median, mean) and spread (interquartile range, standard deviation) of two or more different data sets.
ID-3
Interpret differences in shape, center, and spread in the context of the data sets, accounting for possible effects of extreme data points (outliers).
Clarifications
Tasks for this target will require students to use appropriate statistics to explain difference in shape, center, and spread of two or more different data sets, including the effect of outliers.
Range Achievement Level Descriptors
Evidence Required
1
The student will be able to represent data on the real number line with a dot plot, histogram, or box plot.
2
The student will be able to use statistics appropriate to the shape of the data distribution to compare center (median, mean) and spread (interquartile range, standard deviation) of two or more different...
3
The student will be able to interpret the differences in shape, center, and spread in the context of the data sets.
4
The student will be able to interpret the effects of outliers on the shape, center, and spread of a data set.
Item Guidelines

Depth of Knowledge
M-DOK2
Skill/Concept includes the engagement of some mental processing beyond a habitual response. A Level 2 assessment item requires students to make some decisions as to how to approach the problem or activity, whereas Level 1 requires students to demonstrate a...
Allowable Item Types
- Multiple Choice, single correct response
- Hot Spot
- Matching Tables
Allowable Stimulus Materials
data sets (listed, described contextually, or as a table of values), graphs
Key/Construct Relevant Vocabulary
mean, median, interquartile range, outlier, standard deviation
Allowable Tools
Calculator (varies by task model)
Target-Specific Attributes
None
Accessibility
Item writers should consider the following Language and Visual Element/Design guidelines [1] when developing items. Language Key Considerations: Use simple, clear, and easy-to-understand language needed to assess the construct or aid in the understanding of the...
Development Notes
Much of standard S-ID.A.3 will be assessed at the Claim 4 level.


Task Models
Task Model 1a
Item Types
Multiple Choice, single correct responseDepth of Knowledge
M-DOK2Standards
ID-1
Target Evidence Statement
The student will be able to represent data on the real number line with a dot plot, histogram, or box plot.
Allowable Tools
None
Task Description
Prompt Features: The student is prompted to identify the plot of a given data set. Stimulus Guidelines: Item difficulty can be adjusted via these example methods, but is not limited to these methods: Presence of repeated...
Stimulus
The student is presented with a contextual data set.
Example 1
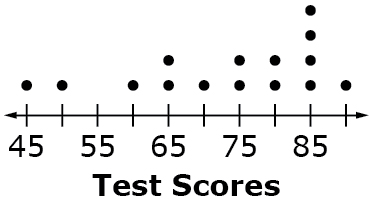
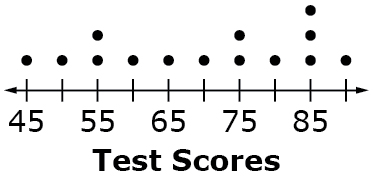
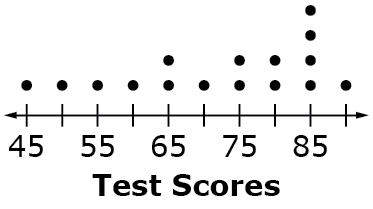
Example Stem 1: Select the dot plot that represents the given test scores.
90, 45, 85, 70, 85, 50, 75, 85, 65, 75, 60, 85, 80, 65, 80
A.
B.
C.
D.
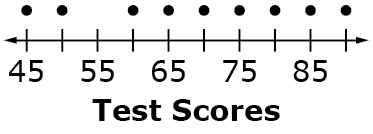
Rubric: (1 point) The student selects the correct option (e.g., A).
Example 2
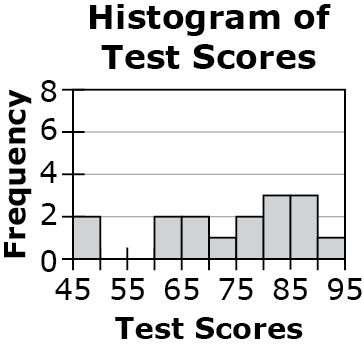
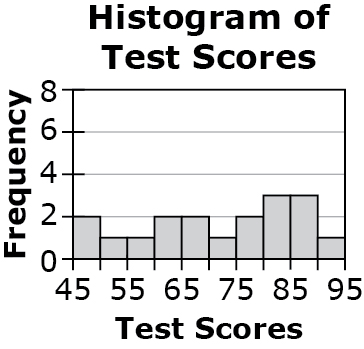
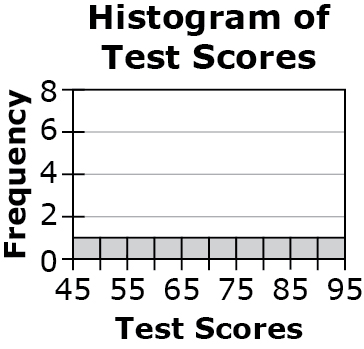
Example Stem 2: Select the histogram that represents the given test scores.
91, 48, 86, 73, 86, 49, 77, 86, 64, 78, 64, 82, 68, 82, 68, 82
A.
B.
C.
D.
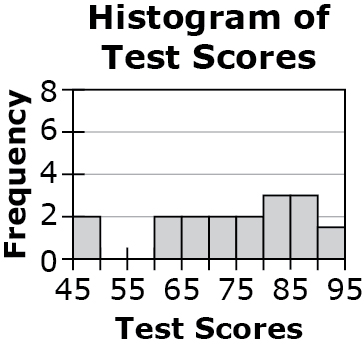
Rubric: (1 point) The student selects the correct option (e.g., A).
Example 3
Example Stem 3: Select the box plot that represents the given test scores.
48, 50, 64, 64, 68, 68, 73, 77, 78, 82, 82, 82, 86, 86, 86, 91
A.
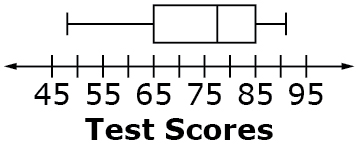
B.
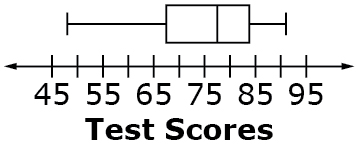
C.
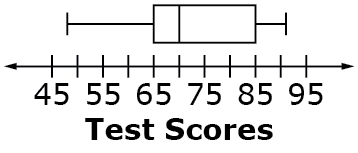
D.
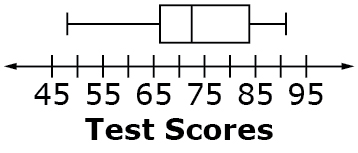
Rubric: (1 point) The student selects the correct option (e.g., A).