Grade 11 - Claim 1 - Target M

 Back to Results
Claim 1
Concepts and Procedures
Standards
IF-7
Graph functions expressed symbolically and show key features of the graph, by hand in simple cases and using technology for more complicated cases.
IF-7a
Graph linear and quadratic functions and show intercepts, maxima, and minima.
IF-7b
Graph square root, cube root, and piecewise-defined functions, including step functions and absolute value functions.
IF-7c
Graph polynomial functions, identifying zeros when suitable factorizations are available, and showing end behavior.
IF-7e
Graph exponential and logarithmic functions, showing intercepts and end behavior, and trigonometric functions, showing period, midline, and amplitude.
IF-8
Write a function defined by an expression in different but equivalent forms to reveal and explain different properties of the function.
IF-8a
Use the process of factoring and completing the square in a quadratic function to show zeros, extreme values, and symmetry of the graph, and interpret these in terms of a context.
IF-8b
Use the properties of exponents to interpret expressions for exponential functions. For example, identify percent rate of change in functions such as $y = (1.02)^{t}$, $y = (0.97)^{t}$, $y = (1.01)^{12t}$, $y...
IF-9
Compare properties of two functions each represented in a different way (algebraically, graphically, numerically in tables, or by verbal descriptions). For example, given a graph of one quadratic function and an algebraic expression...
Clarifications
Tasks for this target will ask students to graph functions (linear, quadratic, square root, cube root, piecewise-defined, polynomial, exponential, and logarithmic) by hand or using technology and compare properties of two functions represented in...
Range Achievement Level Descriptors
Evidence Required
1
Students graph functions expressed symbolically and show key features of the graph.
2
Students write a quadratic function defined by an expression in equivalent factored form and completing the square form to reveal zeros, extreme values, and symmetry of the graph, and interpret these in...
3
Students write an exponential function defined by an expression in an equivalent form using the properties of exponents to reveal and explain different properties of the function and to classify them as...
4
Students compare properties of two functions represented in different ways (e.g., as equations, tables, graphs, or written descriptions).
Item Guidelines

Depth of Knowledge
M-DOK1
Recall includes the recall of information such as fact, definition, term, or a simple procedure, as well as performing a simple algorithm or applying a formula. That is, in mathematics a one-step, well-defined, and straight algorithmic procedure should be...
M-DOK2
Skill/Concept includes the engagement of some mental processing beyond a habitual response. A Level 2 assessment item requires students to make some decisions as to how to approach the problem or activity, whereas Level 1 requires students to demonstrate a...
Allowable Item Types
- Graphing
- Equation/Numeric
- Matching Tables
- Hot Spot
Allowable Stimulus Materials
linear functions, quadratic functions, square-root functions, cube-root functions, piecewise-defined functions, polynomial functions, exponential functions, logarithmic functions, table of values, description of a function, description of a property or key feature of a function
Key/Construct Relevant Vocabulary
quadratic, square root, cube root, piecewise-defined, polynomial, exponential, logarithmic, x-intercept, y-intercept, interval, relative maximum, relative minimum, symmetry, axis of symmetry, end behavior of a graph, limit, periodicity
Allowable Tools
Calculator (varies by task model)
Target-Specific Attributes
Properties and key features include: x- and y-intercepts; intervals where the function is increasing, decreasing, positive, or negative; zeroes; relative maximums and minimums; symmetries; end behavior; and periodicity.
Accessibility
Item writers should consider the following Language and Visual Element/Design guidelines [1] when developing items. Language Key Considerations: Use simple, clear, and easy-to-understand language needed to assess the construct or aid in the understanding of the...
Development Notes
None


Task Models
Task Model 1a
Item Types
GraphingDepth of Knowledge
M-DOK2Standards
IF-7
Target Evidence Statement
Students graph functions expressed symbolically and show key features of the graph.
Allowable Tools
None
Accessibility Note
Graphing items are not currently able to be Brailled. Minimize the number of items developed to...
Task Description
Prompt Features: The student is prompted to graph a simple function and show key features. Stimulus Guidelines: Graphs in answer choices must be within a -20 to 20 coordinate grid, unless otherwise specified. Functions must be chosen...
Stimulus
The student is presented with a function and a coordinate grid.
Example 1
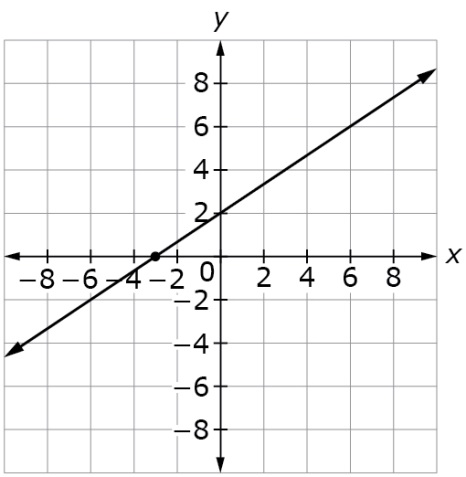
Example Stem 1: Given a linear function with a slope of and a y-intercept of 2:
- Using the Add Arrow tool, draw a line on the coordinate grid to graph the function.
- Place a point on the line representing the x-intercept of the function.

Interaction: The student will graph lines using the Add Arrow tool and/or plot points using the Add Point tool.
Rubric: (2 points) The student graphs the correct line and plots the point at the correct location that represents a key feature [e.g., Example Stem 1, draws a correct line and plots the x-intercept located at (-3, 0)].
(1 point) The student graphs the correct line or plots the point at the correct location that represents a key feature [e.g., Example Stem 1, draws a correct line OR plots the x-intercept located at (-3, 0)].
Example 2
Example Stem 2: Given the function ,
- Using the Add Arrow tool, draw a line on the coordinate grid to graph the function.
- Place a point on the line representing the x-intercept of the function.
Interaction: The student will graph lines using the Add Arrow tool and/or plot points using the Add Point tool.
Rubric: (2 points) The student graphs the correct line and plots the point at the correct location that represents a key feature.
(1 point) The student graphs the correct line or plots the point at the correct location that represents a key feature.
Example 3
Example Stem 3: Given the function ,
- Use the Add Arrow tool to create a graph that represents the function.
- Place a point on the coordinate grid to show the y-intercept of the function.
Interaction: The student will graph lines using the Add Arrow tool and/or plot points using the Add Point tool.
Rubric: (2 points) The student graphs the correct line and plots the point at the correct location that represents a key feature.
(1 point) The student graphs the correct line or plots the point at the correct location that represents a key feature.