Grade 11 - Claim 1 - Target L

 Back to Results
Mathematics
Target L
Interpret functions that arise in applications in terms of a context
Sample Item
Grade 11Test

Claim 1
Concepts and Procedures
Standards
IF-4
For a function that models a relationship between two quantities, interpret key features of graphs and tables in terms of the quantities, and sketch graphs showing key features given a verbal description...
IF-5
Relate the domain of a function to its graph and, where applicable, to the quantitative relationship it describes. For example, if the function h(n) gives the number of person-hours it takes to assemble...
IF-6
Calculate and interpret the average rate of change of a function (presented symbolically or as a table) over a specified interval. Estimate the rate of change from a graph.
Range Achievement Level Descriptors
Evidence Required
1
The student interprets key features of a graph or a table representing a function modeling a relationship between two quantities.
2
The student sketches graphs showing key features given a verbal description of a relationship between two quantities that can be modeled with a function.
3
The student relates the domain of a function to its graph and, where applicable, to the quantitative relationship it describes.
4
The student calculates and interprets the average rate of change of a function presented symbolically or as a table and estimates the rate of change of a function from a graph.
Item Guidelines

Depth of Knowledge
M-DOK1
Recall includes the recall of information such as fact, definition, term, or a simple procedure, as well as performing a simple algorithm or applying a formula. That is, in mathematics a one-step, well-defined, and straight algorithmic procedure should be...
M-DOK2
Skill/Concept includes the engagement of some mental processing beyond a habitual response. A Level 2 assessment item requires students to make some decisions as to how to approach the problem or activity, whereas Level 1 requires students to demonstrate a...
Allowable Item Types
- Matching Tables
- Hot Spot
- Graphing
- Multiple Choice, single correct response
- Multi-Select, multiple correct response
- Equation/Numeric
Allowable Stimulus Materials
written description of key features of a function, graphs of functions in the coordinate plane, tables containing domain and range values of functions, functions presented symbolically
Key/Construct Relevant Vocabulary
x-intercept, y-intercept, interval, increasing interval, decreasing interval, relative maximum, relative minimum, symmetry, axis of symmetry, end behavior of a graph, limit, periodicity, average rate of change
Allowable Tools
Calculator
Target-Specific Attributes
Key features include x- and y-intercepts; intervals where the function is increasing, decreasing, positive, or negative; relative maximums and minimums; symmetries; end behavior; and periodicity.
Functions are in two variables.
Accessibility
Item writers should consider the following Language and Visual Element/Design guidelines [1] when developing items. Language Key Considerations: Use simple, clear, and easy-to-understand language needed to assess the construct or aid in the understanding of the...
Development Notes
Tasks for this target will require students to sketch graphs based on given key features and to interpret key features of graphs, with emphasis on interpreting the average rate of change over a specified...


Task Models
Task Model 1a
Item Types
Matching TablesDepth of Knowledge
M-DOK1Standards
IF-4
Target Evidence Statement
The student interprets key features of a graph or a table representing a function modeling a relationship between two quantities.
Allowable Tools
Calculator
Task Description
Prompt Features: The student is prompted to identify true statements regarding key features of a given graph of a function that models a relationship between two quantities. The statements will be in the context...
Stimulus
The student is given a graph representing a function that models the relationship between two quantities in a real-world situation familiar to 15- to 17-year-olds, e.g., temperature change over time, or population change over...
Example 1
Example Stem: This graph shows the population of mice in a study, modeled as a function of time. The study begins on day 0 and ends on day 200.
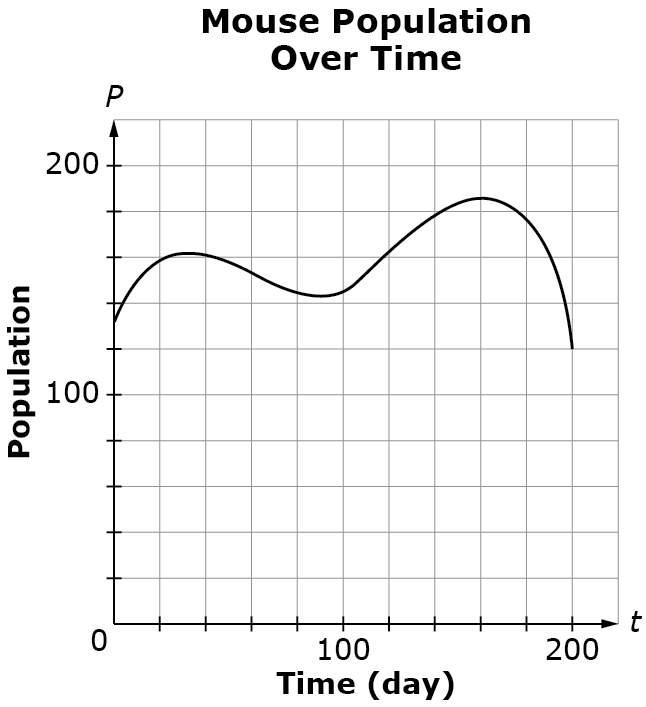
Determine whether each statement is true according to the graph. Select True or False for each statement.
| Statement | True | False |
|---|---|---|
| The mouse population was decreasing between day 40 and day 80. | ||
| The least number of mice during the study was 130. | ||
| The mouse population was at its greatest around day 160. | ||
| There are two intervals of time where the mouse population is decreasing. |
Rubric: (1 point) The student correctly selects true or false for each of the interpretations of key features of the graph (e.g. T, F, T, T).