Grade 11 - Claim 1 - Target J

 Back to Results
Mathematics
Target J
Represent and solve equations and inequalities graphically
Sample Item
Grade 11Test

Claim 1
Concepts and Procedures
Standards
REI-10
Understand that the graph of an equation in two variables is the set of all its solutions plotted in the coordinate plane, often forming a curve (which could be a line).
REI-11
Explain why the x-coordinates of the points where the graphs of the equations y = f(x) and y = g(x) intersect are the solutions of the equation f(x) = g(x); find the solutions approximately, e.g., using technology to graph the functions,...
REI-12
Graph the solutions to a linear inequality in two variables as a half-plane (excluding the boundary in the case of a strict inequality), and graph the solution set to a system of...
Clarifications
Tasks for this target will require students to interpret a line or curve as a solution set of an equation in two variables, including tasks that tap student understanding of points beyond the displayed...
Range Achievement Level Descriptors
Evidence Required
1
The student understands that the graph of an equation in two variables is the set of all its solutions plotted in the coordinate plane, often forming a curve (which could be a...
2
The student finds solutions (either exact or approximate as appropriate) to the equation $f(x) = g(x)$ using technology to graph functions, make tables of values, or find their successive approximations....
3
The student graphs the solutions to a linear inequality in two variables as a half-plane (excluding the boundary in the case of a strict inequality).
4
The student will be able to graph the solution set to a system of linear inequalities in two variables as the intersection of the corresponding half-planes.
Item Guidelines

Depth of Knowledge
M-DOK1
Recall includes the recall of information such as fact, definition, term, or a simple procedure, as well as performing a simple algorithm or applying a formula. That is, in mathematics a one-step, well-defined, and straight algorithmic procedure should be...
M-DOK2
Skill/Concept includes the engagement of some mental processing beyond a habitual response. A Level 2 assessment item requires students to make some decisions as to how to approach the problem or activity, whereas Level 1 requires students to demonstrate a...
Allowable Item Types
- Equation/Numeric
- Multiple Choice, single correct response
- Hot Spot
- Multi-Select, multiple correct response
- Matching Tables
- Graphing
- Graphing, Hot Spot
Allowable Stimulus Materials
blank coordinate plane, sets of coordinate points, table of x and y values, linear graphs in the coordinate plane, nonlinear graphs in the coordinate plane, linear equations, nonlinear equations, systems of linear and nonlinear...
Key/Construct Relevant Vocabulary
linear inequality, system of equations, system of inequalities, polynomial function, rational function, absolute value function, exponential function, logarithmic function, coordinate plane (or coordinate grid), half-plane, open half-plane, closed half-plane
Allowable Tools
Calculator (varies by task model)
Target-Specific Attributes
None
Accessibility
Item writers should consider the following Language and Visual Element/Design guidelines [1] when developing items. Language Key Considerations: Use simple, clear, and easy-to-understand language needed to assess the construct or aid in the understanding of the...
Development Notes
Tasks for Claim 3 will ask students to explain why the x-coordinates of the points where the graphs of the equations $y = f(x)$ and $y = g(x)$ intersect are...


Task Models
Task Model 1a
Item Types
Equation/NumericMultiple Choice, single correct responseDepth of Knowledge
M-DOK1Standards
REI-10
Target Evidence Statement
The student understands that the graph of an equation in two variables is the set of all its solutions plotted in the coordinate plane, often forming a curve (which could be a line).
Allowable Tools
Calculator
Task Description
Prompt Features: The student is presented with a graph in the coordinate plane and prompted to identify a solution to the equation represented by the graph. Stimulus Guidelines: Graphs are on a maximum 20 by 20...
Stimulus
The stem will present a graph in the coordinate plane and ask the student to select an ordered pair, or the coordinate of an ordered pair, that is a solution to the equation represented...
Example 1
Example Stem 1: If x=n then y=6 is a solution to the equation represented by the graph shown.
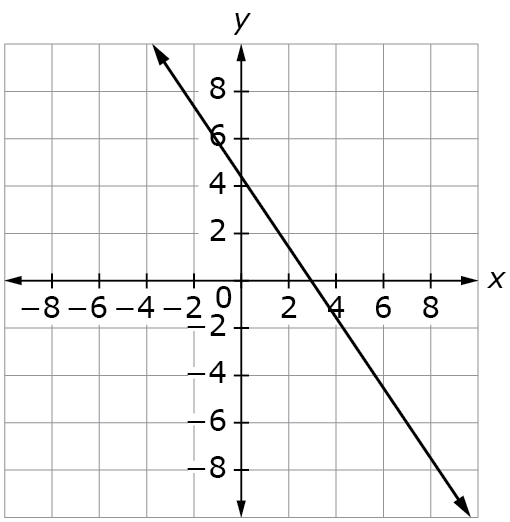
What is the approximate value of n?
A. −13.5
B. −1
C. 4.5
D. 7
Rubric: (1 point) The student identifies the correct value of n (e.g., B).
Response Type: Multiple Choice, single correct response
Example 2
Example Stem 2: If (8, b) is a solution to the equation represented by the graph below, what is the value of b?
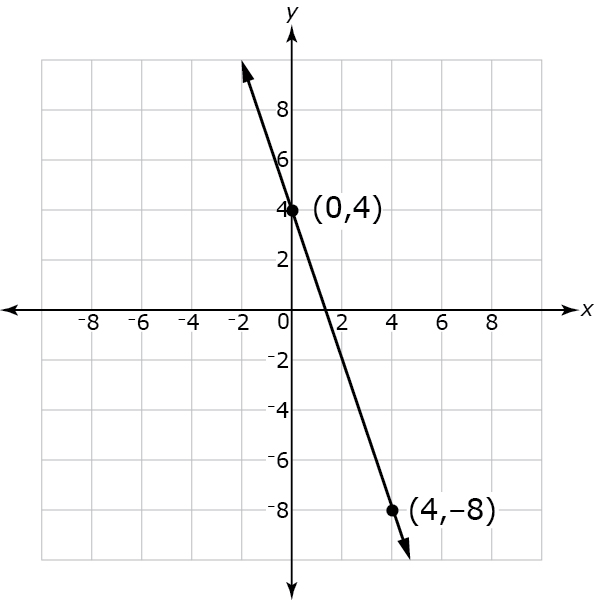
Rubric: (1 point) The student enters the correct value for b (e.g., −20).
Response Type: Equation/numeric